
Introduction
Packaging material cost is not the price printed on the supplier’s quote. It is the cost of every piece of material that reaches your customer, plus the material you waste, the tooling and setup you pay for once, and the freight you pay to move the finished package — divided by the number of units you actually ship. Get those pieces in the wrong place and the number is wrong in a direction you will not notice until a quote lands on your desk.
The calculation has four steps: work out the material cost per unit from a physical specification, add printing and setup, add labor, waste and freight, then land the number by accounting for duties and taxes. Every step depends on one condition — the numerator and the denominator must cover the same period and the same units. Divide a year of material costs by a single month’s shipments and you will conclude your packaging is four times cheaper than it is.
The cost buckets every packaging quote breaks into
Five buckets you will see on any packaging quote
A packaging quote splits into five buckets, and each one is billed differently. Materials are quoted per piece, per sheet, per thousand sheets, per pound, or per square foot, depending on the format. Printing and finishing covers ink, coatings, laminates, foil, and embossing, and is often priced as a separate line from the material. Tooling and setup covers plates, dies, custom molds, and machine make-ready, and is charged once per run. Packaging labor is the time to fold, insert, tape, and label. Freight and duties cover getting the package from the plant to your warehouse or your customer’s door.
Knowing which bucket a number sits in tells you how it will behave when you change something. A per-pound material price moves with the commodity market. A one-time setup fee does not move at all; it simply spreads thinner as the run gets longer.
Fixed vs. variable: what spreads out as you order more
Fixed costs are paid once: custom tool, cutting die, printing plates, first-article samples, and structural design. Variable costs are paid per unit: the substrate, the ink, the labor to assemble, and the freight to ship.
The practical consequence is that two quotes for the same box can differ by 40% for reasons that have nothing to do with the material. Spread the same $235 of die and setup over 500 boxes and it costs $0.47 per box; spread it over 5,000 boxes and it costs $0.047. Neither box changed. The arithmetic did.
The costs most guides leave out
Four costs sit outside most packaging budgets and should sit inside yours. Waste and yield loss is material you buy and do not ship, from print misregistration, die damage, and setup sheets. Storage and dead stock is the cash tied up in material you bought to hit a minimum order quantity but cannot use before it changes. Returns and repacking is the cost of a package that failed in transit. Duties and compliance fees apply to imported material and, in some jurisdictions, to the producer of the packaging rather than the seller of the goods.
A per-unit figure that leaves these out is a materials cost, not a packaging cost. Say which one you are quoting, because the two are used for different decisions.
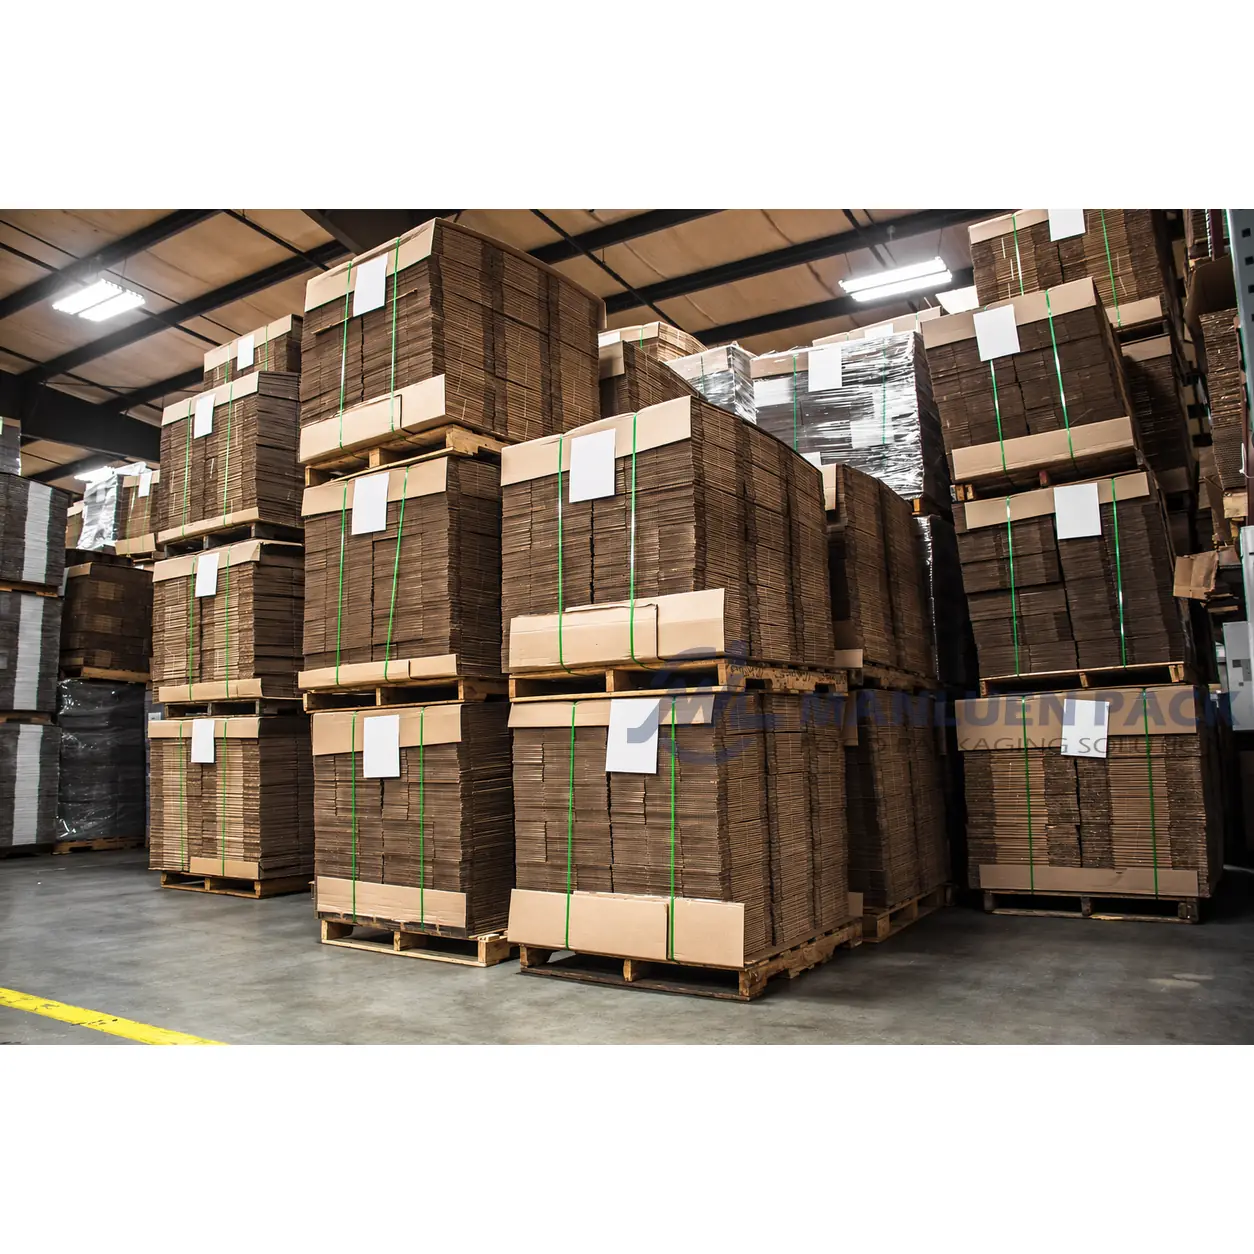
Step 1 — Get the material cost per unit
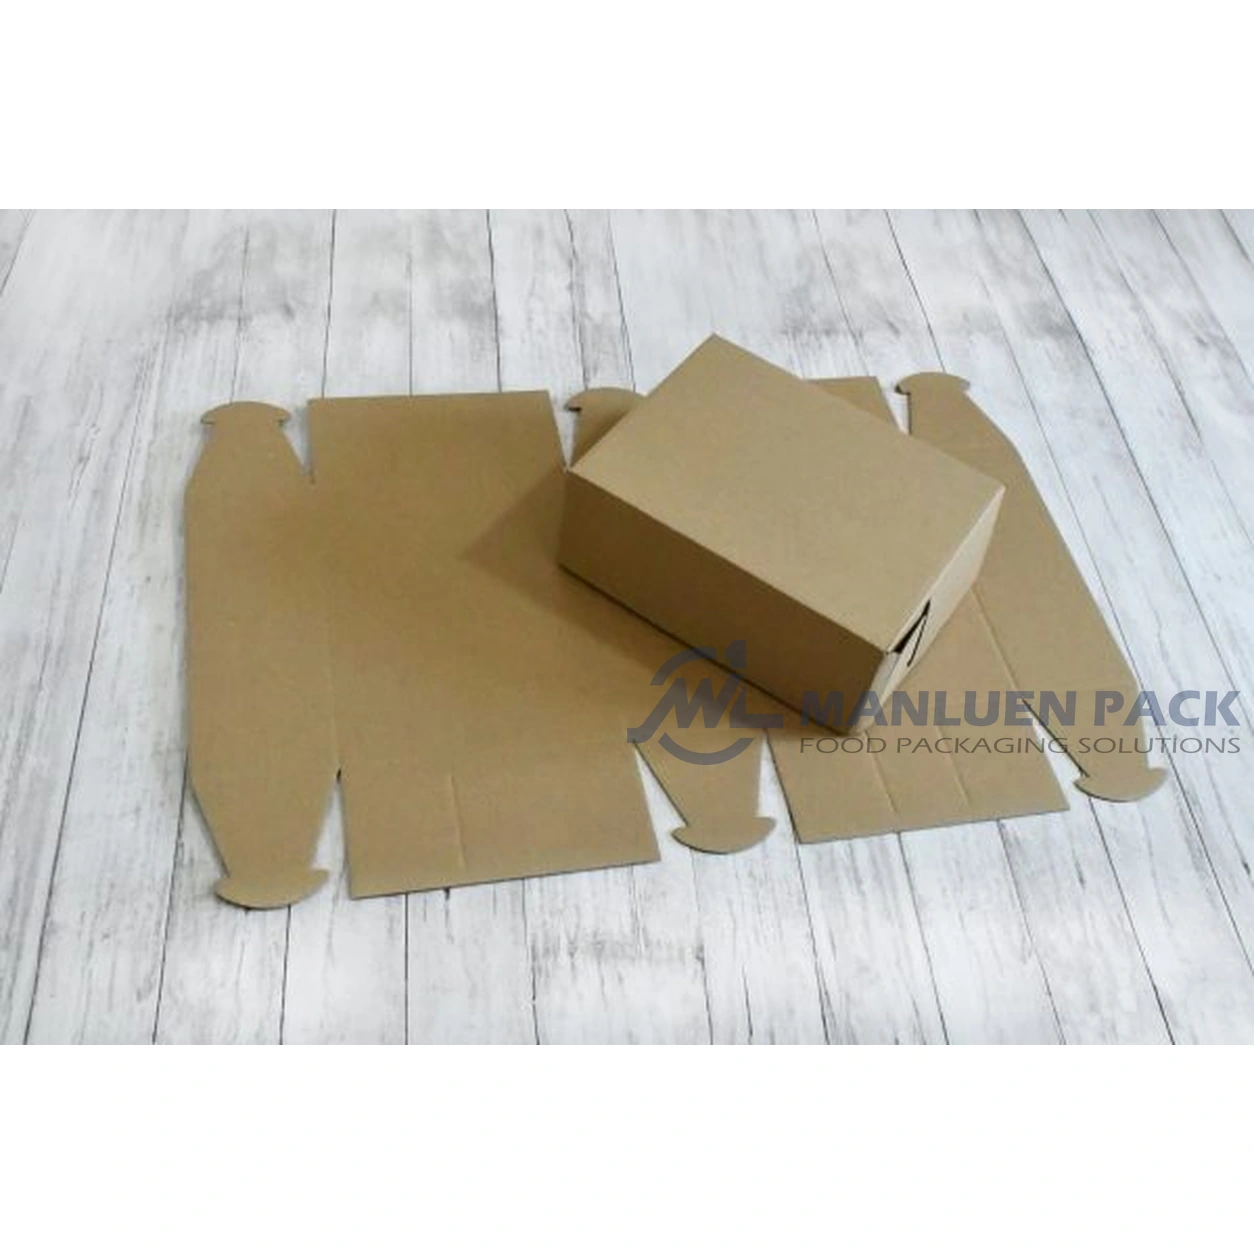
Corrugated and rigid boxes: from a flat blank to a per-box number
A box is cut from a flat blank, so the material cost starts with the blank’s area, not the box’s dimensions. Work through this chain in order:
- Blank dimensions.The die layout determines the flat size of the sheet, which is larger than the finished box. Take it from the dieline, not from the outside dimensions of the box.
- Blank area.Multiply length by width, then divide by 144 to get square feet.
- Board weight.Multiply the area by the board weight in pounds per 1,000 square feet, which is set by the grade and the edge crush test rating.
- Material cost.Multiply the weight by the price per pound, or multiply the area by the price per 1,000 square feet. These two should agree; if they do not, one of your numbers is wrong.
- Sheets per unit.Divide the purchase quantity by the number of blanks per sheet.
- Yield.Divide by the yield percentage to get the cost per usable unit.
Step 6 is where hand calculations quietly go wrong. A board price of $95.00 per 1,000 square feet buys you a certain amount of board, but 4% of it will be waste, so the cost per shippable box is the cost per blank divided by 0.96, not the cost per blank.
Flexible packaging and pouches: price per kilogram is not price per pouch
Film is quoted by weight, but a pouch consumes film by area, so the decisive number is yield — square meters per kilogram. Ask the supplier for the yield of the specific film on the specific roll, and for the thickness in microns or mils, because material consumption and cost both rise almost linearly with thickness.
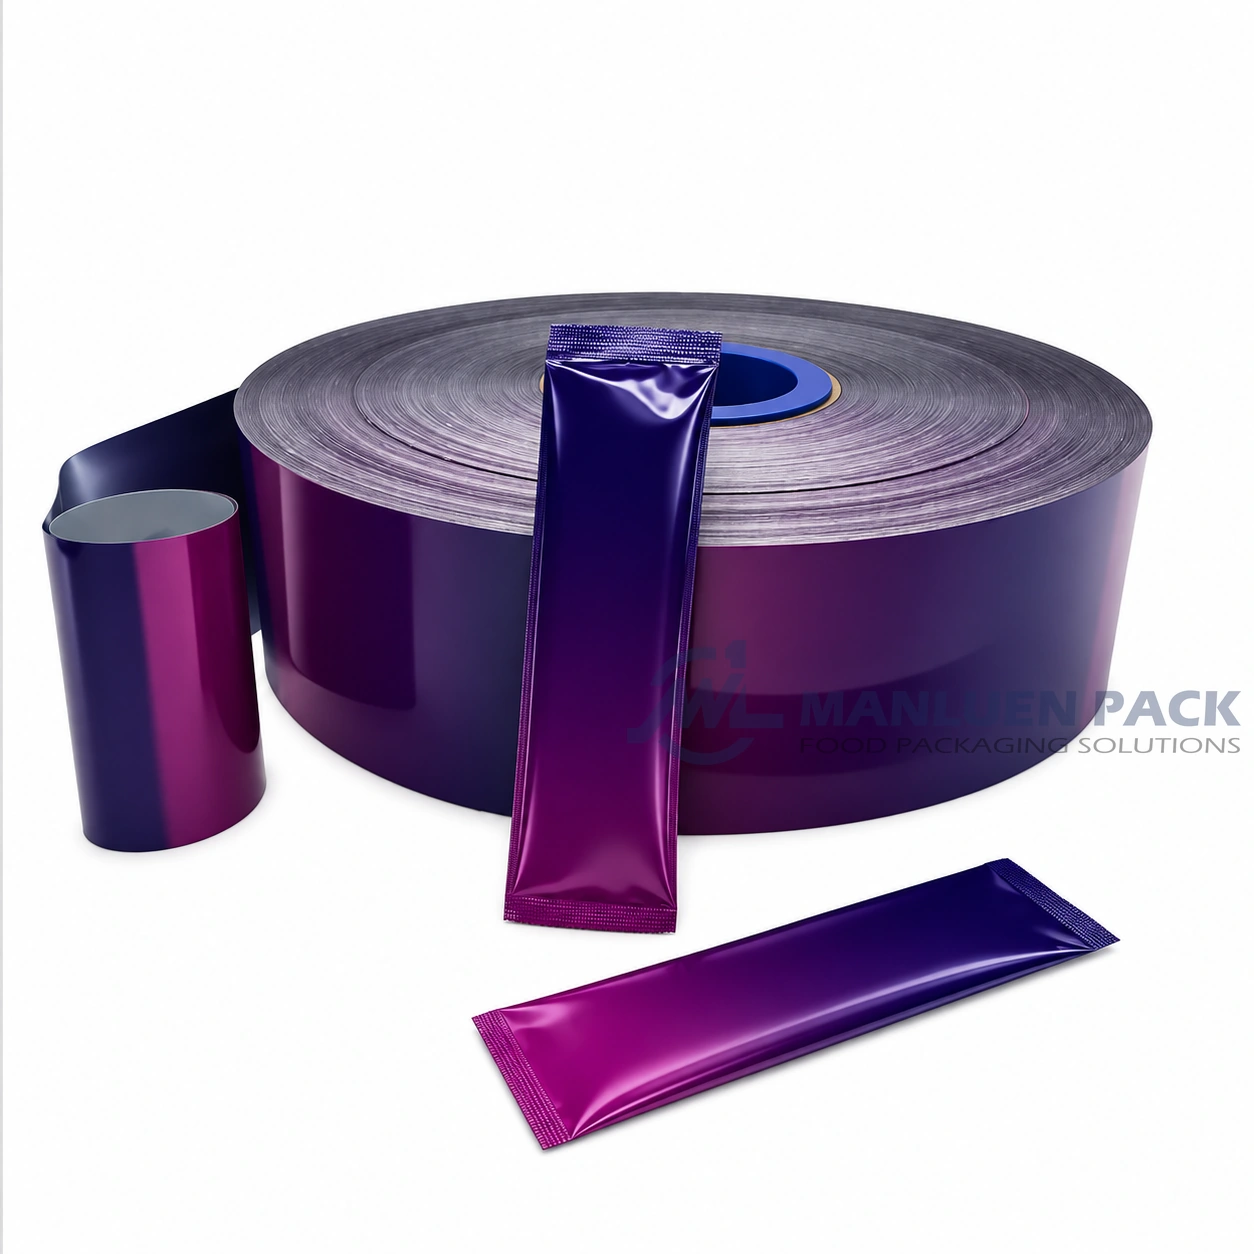
Structure drives the price more than people expect. A mono-material polyethylene film costs less than a multi-layer structure that adds PET, foil, or a barrier layer for oxygen and moisture, and each added layer adds both material and a process. A flat or three-side-seal pouch consumes less film and fewer process steps than a stand-up pouch with a zipper and a spout.
Where to get current US material prices
Start with the official producer price indexes, which are published monthly and are free to read. The producer price index for corrugated and solid fiber box manufacturing stood at 506.129 in September 2026, about 8.9% higher than a year earlier and 10.3% above its 2025 monthly average of 459.033 [1]. Paperboard mills rose 6.8% year over year, to 418.078 in September 2026 [2]. Plastics material and resin manufacturing reached 327.535 in September 2026, up 5.9% from a year earlier but down about 10% from its May 2026 peak of 364.982 [3].
Those three series tell you the direction and roughly the magnitude of input price pressure in a way no supplier brochure will. They are indexes, not quotes, so they cannot tell you what your box costs; they tell you whether the quote you were given last quarter still makes sense.
For actual prices, use a distributor’s published price list for the format you need, and check the date on it. Board and resin prices move, so any cost model should carry a price date, and a model without one is a guess.
Step 2 — Add printing, finishing, and setup
Process and color: what actually moves the price
The print process changes the arithmetic, not just the appearance. Flexographic printing uses relatively cheap plates and cheap make-ready, which suits shorter runs and frequent design changes. Lithography carries higher setup but is cheaper per piece at volume. Digital printing avoids plate charges entirely, which makes it the sensible choice below a few hundred units even though the per-piece price is higher.
Within any process, color count and coverage move the price. The same box with one color costs less than the same box with four, and a box printed on one face costs less than one printed on both. Coatings, laminates, and finishes are frequently quoted separately from the print line, so ask whether they are inside the unit price or on top of it.
Plates, dies, and machine setup: amortize them, and find your break-even quantity
Divide every one-time charge by the number of units the run actually produces. A $140 cutting die over 5,000 boxes is $0.028 per box; the same die over 500 boxes is $0.28 per box.
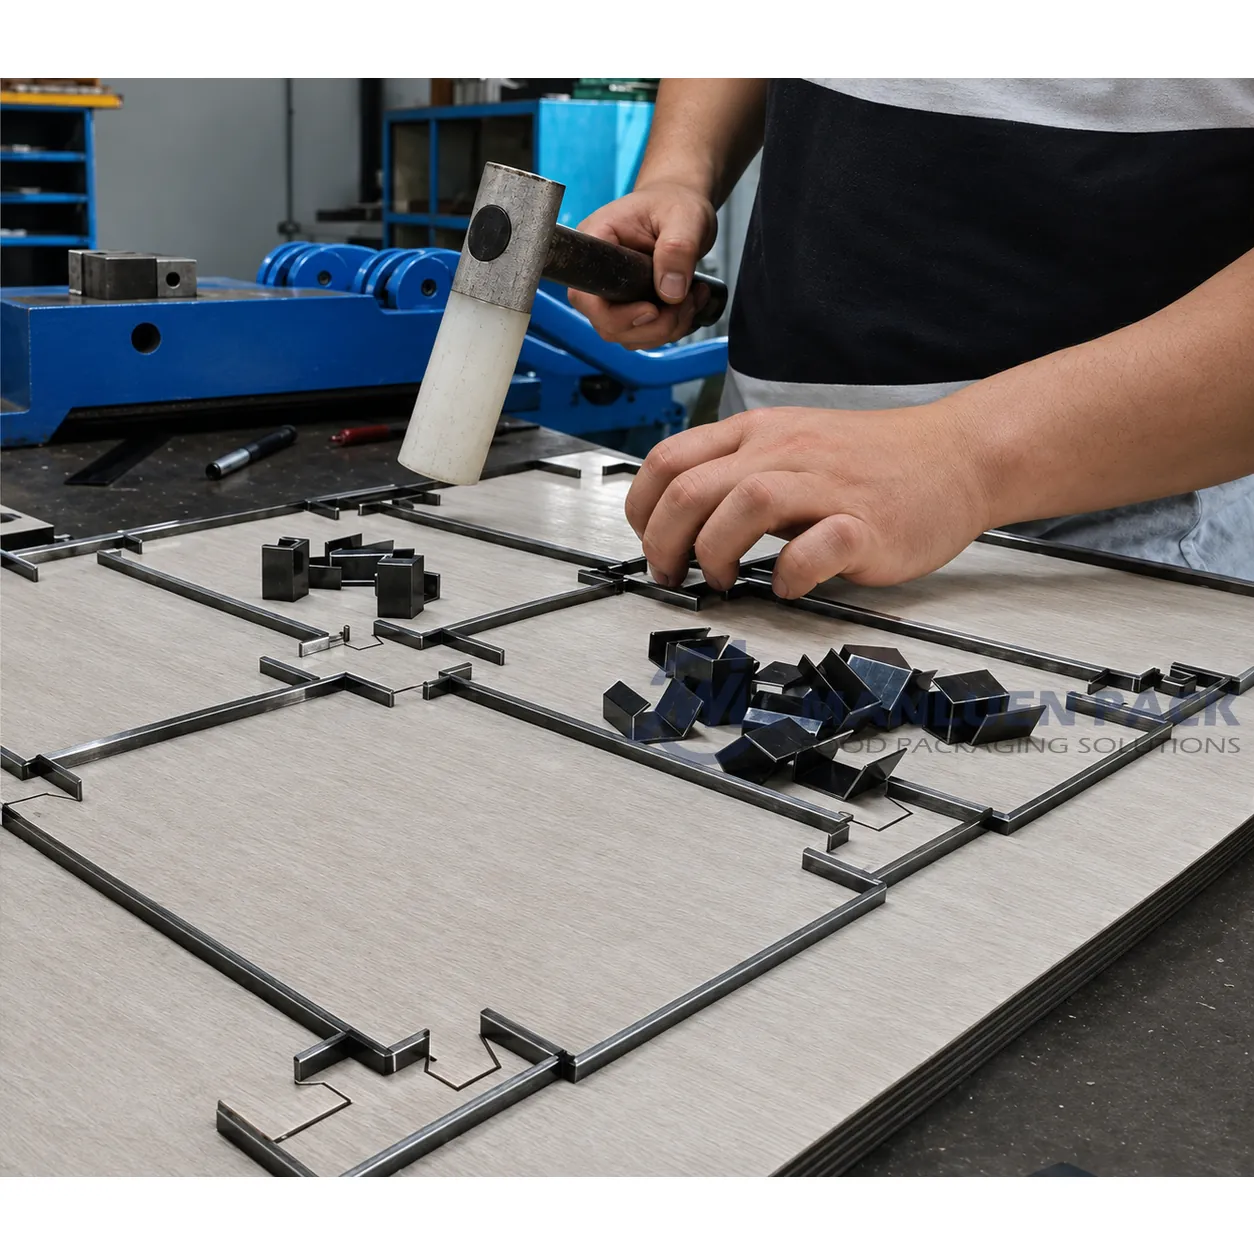
This gives you the break-even quantity between custom and stock packaging, which is the number most guides never calculate. Suppose a stock box costs $1.05 per unit at any quantity, while a custom box costs $0.62 per unit at 5,000 units plus $235 of one-time die and setup. The saving per unit is $0.43, so the custom box wins once the run passes $235 ÷ $0.43, or about 547 units. Move the base custom price to $0.70 and the break-even moves to roughly 671 units, because a rise in board prices moves the point where custom pays for itself. This is the standard break-even calculation applied to packaging: fixed costs divided by the contribution each unit contributes, published by the Small Business Administration as Fixed Costs ÷ (Price − Variable Costs) = Break-Even Point in Units [8]. Recalculate the number whenever material prices shift, and revisit it whenever the format changes, since a die is specific to a specific box structure.
Step 3 — Add labor, waste, and freight
Packaging labor: measure the task, then pick a rate
Time the whole task, from picking the item to a sealed and labeled parcel ready for handoff, and record it in minutes. Convert with the formula minutes ÷ 60 × hourly rate. The measured time should include folding, inserting, taping, and labeling, and should be consistent about whether picking from the shelf and printing the label are inside the measurement.
Then pick a rate and label it. A wage-based rate is the hourly wage alone. A fully loaded rate adds payroll taxes, benefits, paid time off, training, and a share of supervision, and on US manufacturing wages it commonly lands 30% to 50% above the base wage. Two quotes built on different rates are not comparable, and the gap between them is invisible unless you label both.
Waste and yield loss: add it once, in the right place
There are two correct ways to record yield loss, and using both at once is the most common arithmetic error in packaging costing. Either you divide the material cost by the yield percentage, so a cost of $0.4374 per blank at 96% yield becomes $0.4556 per usable unit, or you add a separate allowance line at the end of the calculation.
The rule is simple: if the supplier’s unit price already reflects their expected defect rate, do not add an allowance for the same loss again. And if the allowance covers material only, do not also apply it to labor or freight, because damaged units are not packed and not shipped.
Until you have your own data, use a temporary allowance and mark it as an estimate. Replace it with observed data as soon as you have it: record the affected material and quantity over a defined period, then divide that cost by the number of orders shipped in the same period. That number is far more useful than a percentage copied from a blog.
Freight and dimensional weight: why a smaller box often beats a cheaper material
Carriers bill on the greater of actual weight and dimensional weight, so a large, light package can cost more to ship than a small, dense one. USPS publishes the rule for domestic packages: dimensional weight rates apply to packages larger than 1 cubic foot (1,728 cubic inches), and the calculation is to multiply length by width by height and divide by 139, with any fraction of an inch rounded up to the next whole inch. If the dimensional weight is greater than the actual weight, you pay the dimensional weight [4].
USPS’s own example makes the effect concrete: a package measuring 16 by 12 by 10 inches has a volume of 1,920 cubic inches, which divided by 139 gives 13.81 and rounds to 14 pounds of dimensional weight, against an actual weight of 5 pounds, so it ships as if it weighed 14 pounds. USPS also lists the surcharges that make oversized boxes more expensive: nonstandard length charges of $4.50 for packages between 22 and 30 inches and $10.00 to $21.00 beyond 30 inches depending on service, and nonstandard volume charges of $21.00 to $35.00 for packages over 2 cubic feet.
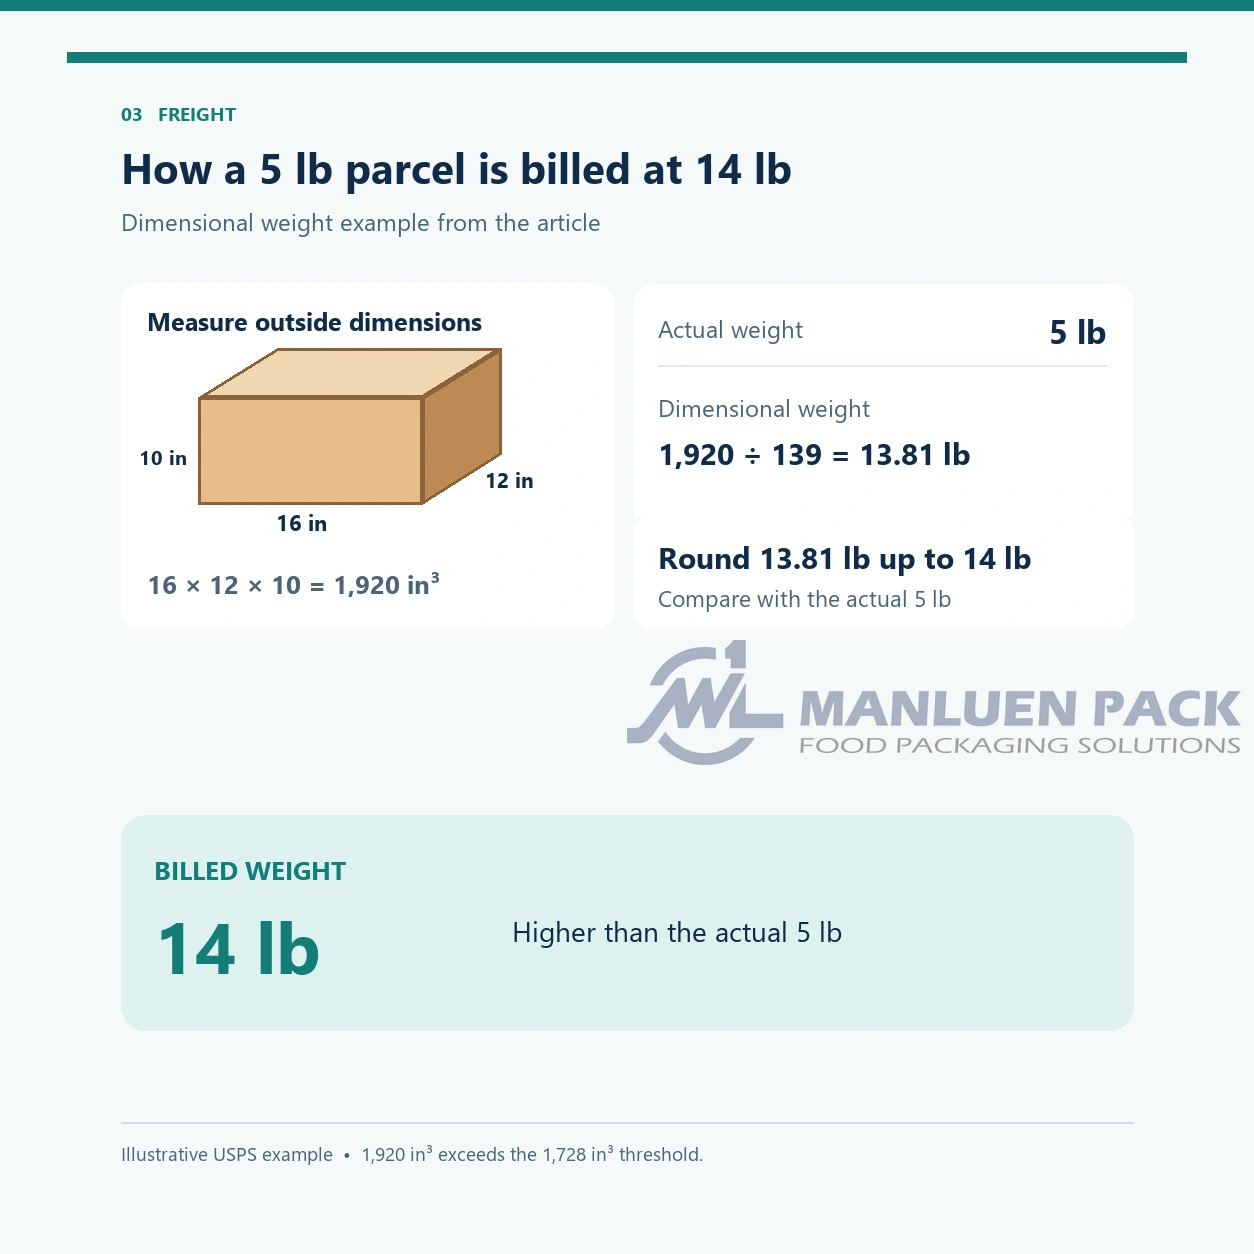
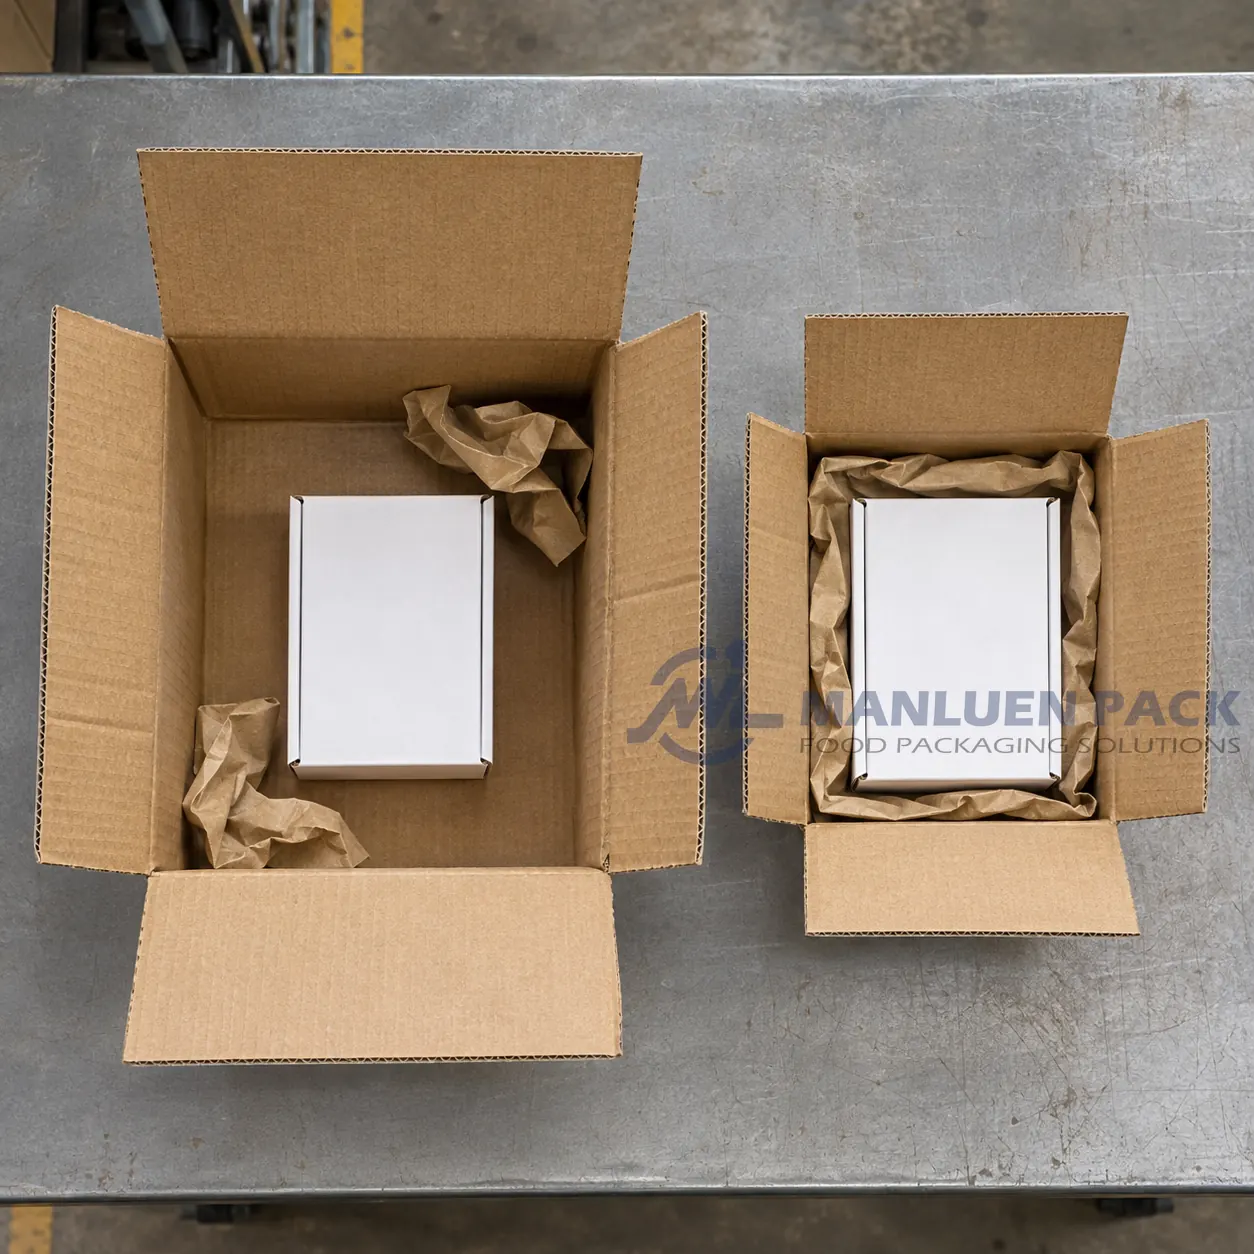
The practical rule follows directly. A smaller box of the same product frequently saves more in postage than switching to a cheaper material saves in material, and it also reduces the volume you pay to store. Right-size the package before you renegotiate the material.
Step 4 — Land the number: duties, taxes, and trade terms
Landed cost vs. factory price
The same box can be quoted three ways, and only one of them tells you what you will pay. An ex-works price covers the goods at the seller’s door. A price on FOB terms covers goods loaded for shipment at the named port or place of shipment. A delivered price covers the goods to your door, and it may or may not include duty.
Freight and duties are sometimes billed separately, which means a supplier’s unit price can be perfectly accurate and still be far less than what you actually spend. Always ask whether the quote is ex-works, FOB, or delivered, and whether duty is included. When you compare two quotes, compare them on the same term, or the comparison is meaningless.
US import duties and state sales tax on packaging materials
Packaging has its own classification lines in the Harmonized Tariff Schedule. In the 2026 HTS, cartons, boxes, and cases of corrugated paper or paperboard sit in subheading 4819.10.00 and folding cartons of non-corrugated paper or paperboard in 4819.20.00, each listed with a general rate of Free alongside a 35% rate for trading partners without most-favored-nation status; sacks and bags of polyethylene sit in 3923.21.00, with a general rate of 3% [5].
Additional duties are applied on top of the general rate under the Section 301 actions, and every product covered is identified by an 8-digit or 10-digit HTS subheading in the published tariff action lists [6]. The practical instruction is short: identify the subheading for your material, look up the rate that applies to your country of origin on the shipment date, and check whether a trade-remedy measure covers it. Rates change, so record the date you checked.
Sales tax on packaging materials is a separate matter and it is decided state by state, depending on whether the seller has nexus in the state and how the material is classified. Any worked example must therefore state its shipping state and whether the figure is tax-inclusive, which is why the examples below use pre-tax figures and say so.
Worked examples: two complete calculations
The two examples below use illustrative inputs, not market quotes, and are shown so that every line can be checked and replaced with your own figures.
Example A — a poly mailer, 2,500 units
One mailer per order, so every line is also a per-order figure.
| Line | Input | Per order |
| Film material before yield | $0.38 ÷ 96% yield | $0.3958 |
| Flexo plate, one-time | $85.00 ÷ 2,500 units | $0.0340 |
| Packing labor | 0.4 min ÷ 60 × $22.00/hr | $0.1467 |
| Packaging subtotal | $0.5765 | |
| Freight, one 14 × 11 × 9 in parcel, 5 lb | $5.20 | |
| Delivered per order | $5.78 |
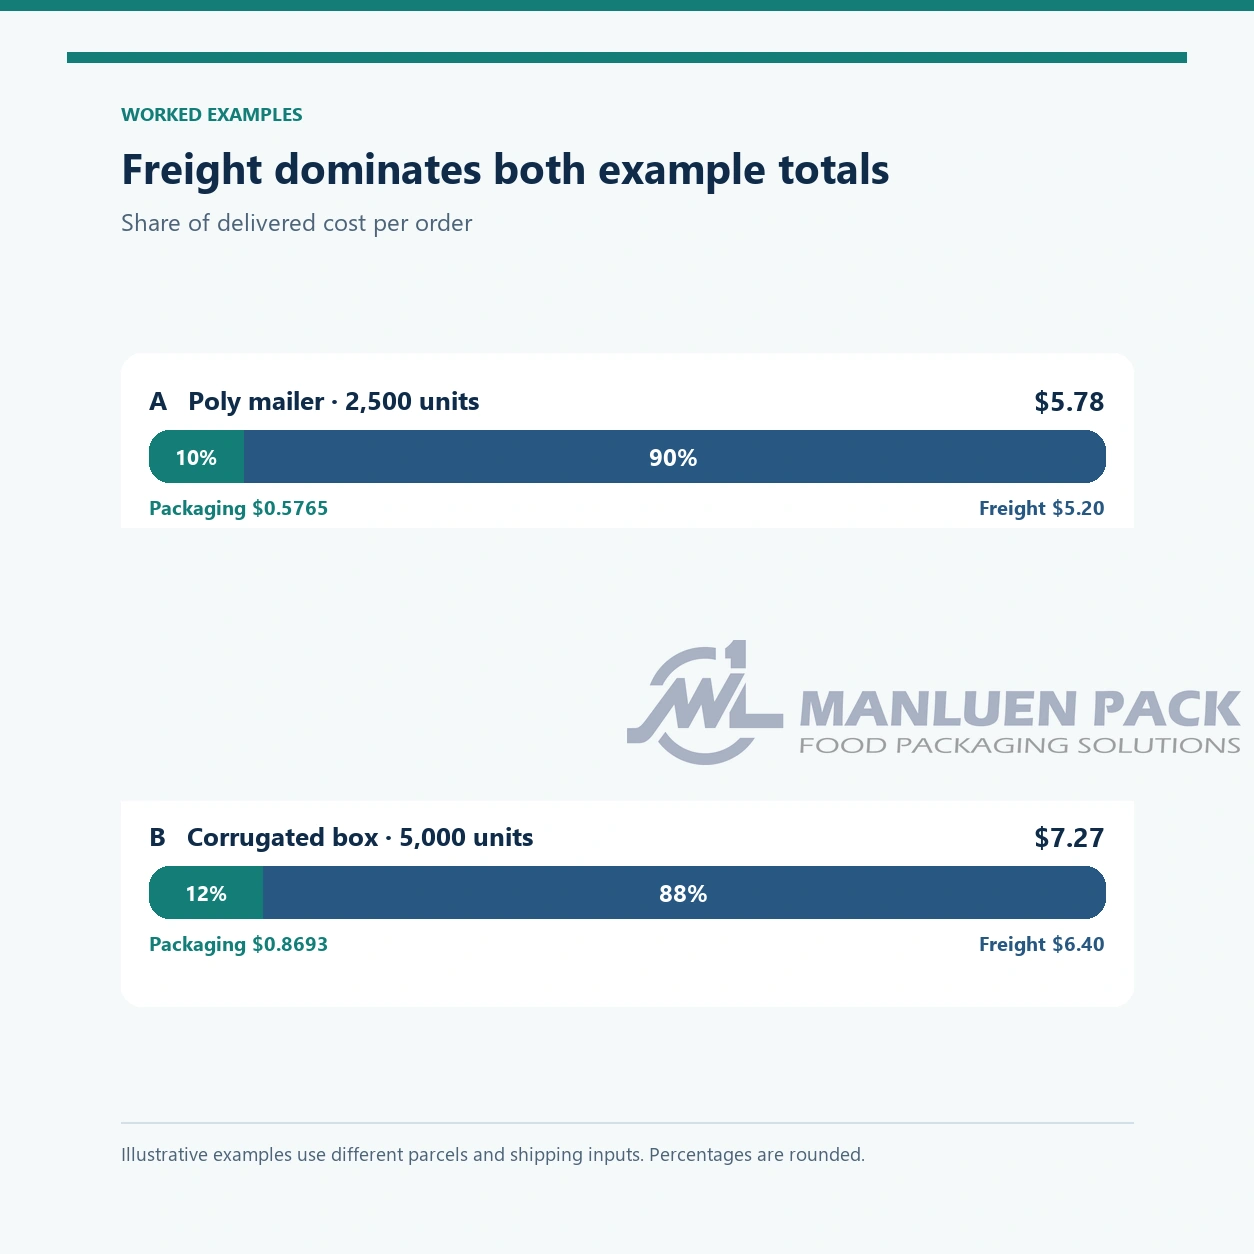
The packaging itself is about a tenth of what the order costs to deliver, and that ratio is the reason freight belongs in the model even though it is not packaging material. It is also why the dimensional rule matters here: this parcel is 1,386 cubic inches, below the 1,728-cubic-inch threshold, so it ships on actual weight. Had the same mailer been packed in a 16 × 12 × 10 inch box, it would have shipped as if it weighed 14 pounds rather than 5.
Example B — a corrugated box, 5,000 units
A 12 × 9 × 4 inch single-wall box at 32 ECT (edge crush test rating, in pounds per inch), from an assumed 39 × 17 inch blank.
| Line | Calculation | Per box |
| Blank area | 39 × 17 ÷ 144 | 4.604 sq ft |
| Board weight | 4.604 sq ft × 44 lb per 1,000 sq ft | 0.2026 lb |
| Material at $95.00 per 1,000 sq ft | 4.604 ÷ 1,000 × $95.00 | $0.4374 |
| Adjusted for 96% yield | $0.4374 ÷ 0.96 | $0.4556 |
| Print, two colors flexographic | $0.1100 | |
| Cutting die, one-time | $140.00 ÷ 5,000 units | $0.0280 |
| Setup, one-time | $95.00 ÷ 5,000 units | $0.0190 |
| Packing labor | 0.7 min ÷ 60 × $22.00/hr | $0.2567 |
| Packaging per box, pre-freight and pre-tax | $0.8693 | |
| Freight, one 12 × 9 × 4 in parcel, 1.5 lb | $6.40 | |
| Delivered per order | $7.27 |
Run the same box at 1,000 units instead of 5,000, with board at $120.00 per 1,000 square feet and print at $0.15, and the per-box figure becomes $1.2172 — 40% higher. Nothing about the box changed; the amortization and the volume tier did.
The worksheet: every input, its unit, and where it comes from
| Cost bucket | Input | Unit | Where the number comes from | Example |
| Material | Board or film price | $ per 1,000 sq ft, per lb, or per kg | Distributor price list; PPI series for direction [1][2][3] | $95.00 per 1,000 sq ft |
| Material | Blank area or film yield | sq ft per unit; sq m per kg | Dieline; supplier spec sheet | 4.604 sq ft |
| Material | Yield | % | Supplier; then your own observed rate | 96% |
| Printing | Process, colors, coverage | $ per unit | Quote line item | $0.11 |
| Finishing | Coating, laminate, foil, emboss | $ per unit or setup fee | Quote line item | $0.03 |
| Tooling | Die, plate, custom mold | $ one-time | Quote, amortized over units produced | $140.00 |
| Setup | Machine make-ready | $ one-time | Quote, amortized over units produced | $95.00 |
| Labor | Time per order | minutes | Your own time study | 0.7 min |
| Labor | Hourly rate | $ per hour, wage or fully loaded | Your payroll, labeled | $22.00 |
| Waste | Allowance | $ per order | Observed losses ÷ orders shipped | $0.00 |
| Freight | Billed weight | lb | Carrier; max of actual and dimensional | 1.5 lb |
| Freight | Rate and surcharge | $ per parcel | Carrier’s published rate guide [4] | $6.40 |
| Duties | HTS subheading and rate | % | HTS and USTR lists [5][6] | per origin |
| Storage | Volume and dwell time | $ per order | Rent per sq ft ÷ turnover | $0.02 |
| Returns | Incidents and cost each | $ per order | Damage records ÷ orders shipped | $0.07 |
Keep one row per order type or per product family, annotate every input with its source and the date you took it, and you have a model you can defend to a supplier and to your own finance team.
How the number moves
Order volume and the price breakpoints you will hit
Quantity breaks are not secret. Ask for the tiered price list and note where each tier starts, because the step at each tier is often larger than the amortized setup it saves. Minimum order quantities carry a second cost that never appears in the unit price: the cash tied up in material you cannot use yet, and the risk that it becomes obsolete when the design changes. A deeper discount on material that ends up dead stock is not a saving.
Sensitivity: what a 10% material price move does
Take the 5,000-unit box above. A 10% increase in the board price adds $0.0456 per box, which is 5.2% of the $0.8693 packaging total, because material is only about half the cost of the box. The same 10% move adds 4.7% to the 1,000-unit figure, where setup and print make up more of the total. This is the practical reason to model material as a variable input rather than a fixed assumption: the pass-through to your total is partial and it depends on your order size.
When cutting material back costs more than it saves
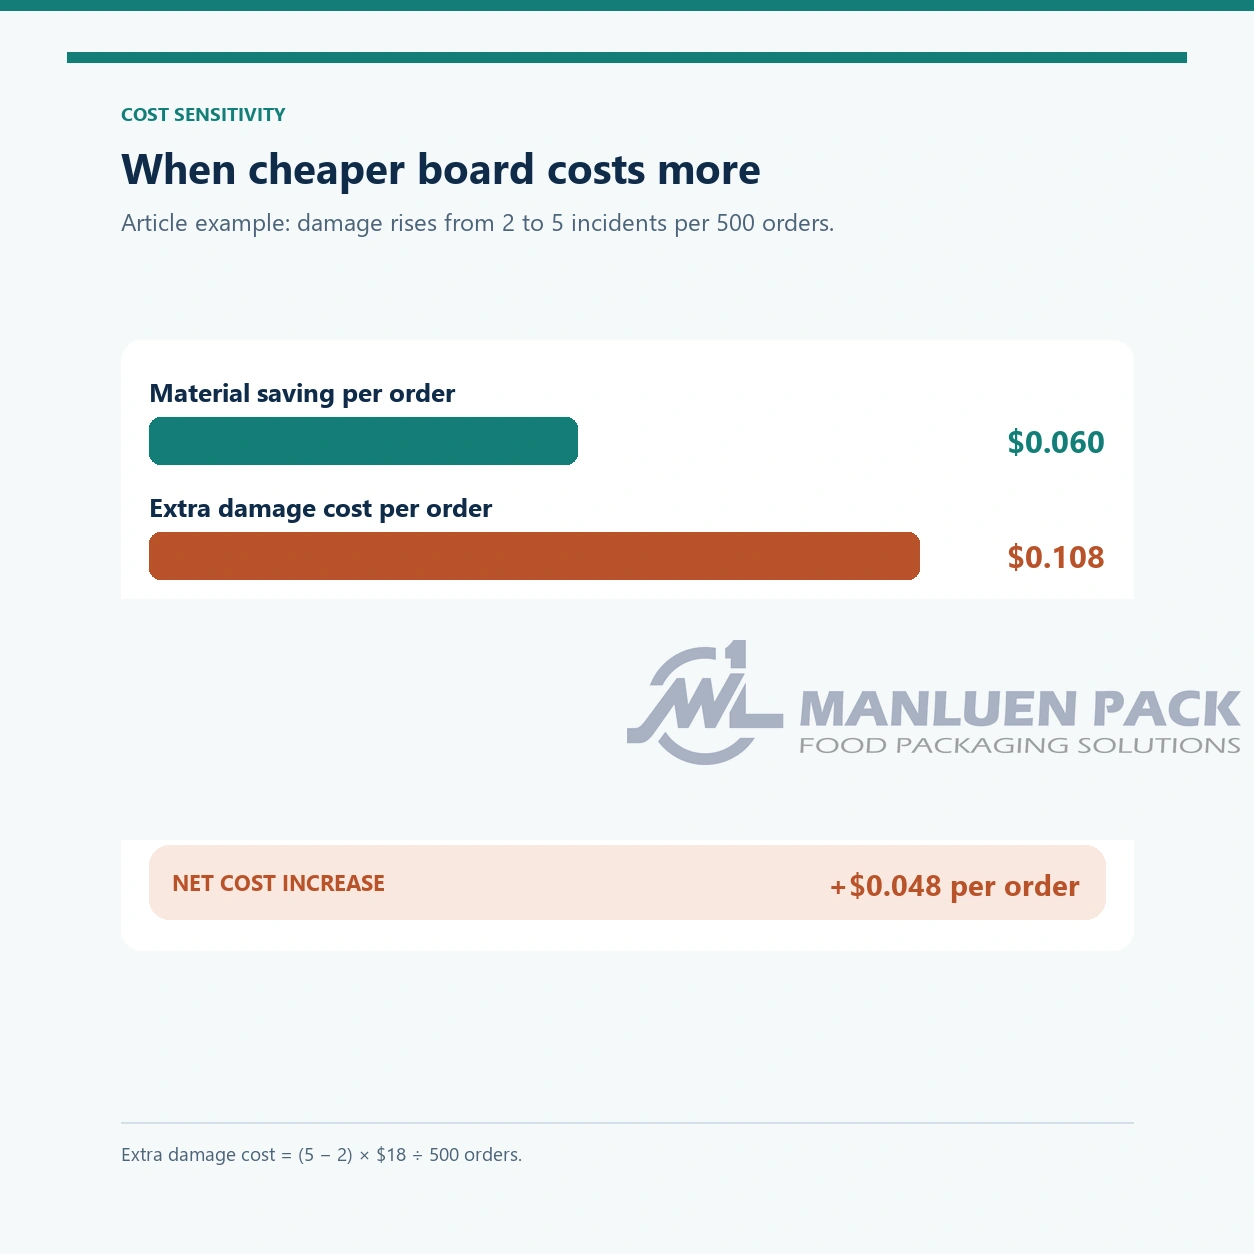
Thinner board or fewer layers saves a few cents per unit and can raise damage. Compare the two numbers directly. Suppose a downgrade saves $0.06 per box, but incidents rise from 2 in 500 orders to 5 in 500 orders at $18.00 of direct cost each. The current damage allowance is 2 × $18.00 ÷ 500 = $0.072 per order, the new one is 5 × $18.00 ÷ 500 = $0.18 per order, and the increase of $0.108 per order is larger than the $0.06 saved. The downgrade loses money, even though it improved the line that was being optimized.
Measure damage the same way every time: count the incidents plausibly caused or worsened by the packaging, multiply by the direct cost of each, and divide by the number of comparable orders in the same period. When you change the design, you have no history for the new package, so keep the allowance flat until the data arrives rather than assuming it improved. Packaging performance can be tested rather than guessed: ISTA procedure 3A is a general simulation test for individual packaged products shipped through a parcel delivery system, and is the appropriate reference for standard, small packages distributed individually by air or ground [7].
What packaging should cost as a share of price
You will find published ranges for packaging as a share of retail price, and you should treat them with suspicion. A figure that circulates widely through vendor guides and small-business blogs often traces back to a single undated post with no stated methodology and no definition of the denominator, whether it means retail price, cost of goods, or selling price. Two guides giving the same number are not two sources.
The reliable method is to derive the ratio yourself from your own numbers, using the calculation below.
Reverse calculation: set the margin, then work out the unit cost you can afford
Worked backwards, with a retail price of $39.00 and a target gross margin of 55%: cost of goods is $39.00 × 0.45 = $17.55. Subtract a product cost of $13.10 and $2.20 of fulfillment cost that is not packaging, and the packaging budget is $17.55 − $13.10 − $2.20 = $2.25 per order. If you ship one unit per order, you can spend $2.25 on packaging and still hit the margin.
The same arithmetic reads the other way, which is the more useful direction. If packaging actually costs $2.90 per order, gross margin is ($39.00 − $13.10 − $2.20 − $2.90) ÷ $39.00 = 53.3%, not 55%. You can also solve for the retail price a given packaging cost supports, which is often the number a pricing conversation actually needs.
This method has one advantage over a published ratio: every input is one you already know and can defend, and it produces a target specific to your product, your format, and your volume instead of an average across someone else’s.
Get comparable quotes
What to ask every supplier for, in writing
Ask for the same list every time, in writing, and require the answer to be attached to the quote:
- Material and grade, with thickness, caliper, or grammage
- Board or film specification and, for corrugated, the edge crush test rating
- Finished dimensions and the die layout, or the dieline
- Print process, number of colors, and single- or double-sided
- Every finish: coating, laminate, foil, emboss, varnish
- Plate, die, and custom tooling charges, and whether they are refundable
- Setup or first-article charges
- Minimum order quantity and the full tiered price list
- Over- and under-run policy, and whether you can reorder the balance
- Price validity period, and whether the price escalates with material indexes
- Lead time, and the cost of expediting
- Delivery term, who pays duty, and whether the quote includes freight
- Whether the quote is tax-inclusive, and for which state
How to line up three quotes on the same basis
“Comparable” means the same specification, the same print, the same quantity, the same delivery term, and the same tax treatment. A delivered quote compared against a factory quote will always look better or worse for reasons that have nothing to do with packaging quality, and the most common version of this error is comparing a quote that includes freight with one that does not.
The fastest way to a comparable number is a one-page specification sheet that you send to all three suppliers, so that each is quoting the same box rather than the nearest thing to it.
Where US numbers break
Europe and the UK: producer fees and packaging rules change the math
In the EU, the cost of packaging is not only the packaging. Producer responsibility schemes add per-item fees that scale with material and with the weight placed on the market, and the EU’s packaging regulation adds design, recycled-content, and labeling requirements that can change which material is viable and therefore what it costs. VAT treatment differs as well, and quotes that include VAT need to be separated out before they can be compared with US figures. A US-derived cost model transfers to those markets only as a starting structure; the numbers have to be rebuilt against local fees.
Format notes: rigid, corrugated, flexible, and labels do not price alike
A rigid box carries hand-assembly labor and often custom tooling, so its cost structure includes labor that a corrugated box does not. Corrugated is the most standardized format and the easiest to price from a published spec. Flexible packaging prices off film yield and print process rather than board weight. Labels cost very little per piece but are frequently managed outside the packaging budget, which is where a surprisingly large share of unit cost goes missing. The worked examples above assume corrugated and a printed film mailer; a rigid or composite structure needs its own model.
Frequently asked questions
How do I calculate packaging material cost per unit?
Divide the total cost of the packaging run by the number of units the run actually produces. The total includes material at delivered cost adjusted for yield, printing and finishing, setup and tooling amortized over the run, packaging labor, freight and duties, and any storage or returns allowance you track. Use the same period in the numerator and the denominator.
Is packaging material cost the same as total packaging cost?
No. Material is usually the largest single bucket, often around half of a corrugated box’s cost, but not the whole of it. Material cost answers “what is the substrate worth”; total packaging cost answers “what does it cost me to put and ship this product”. Use the total figure with your finance team and the material figure when you are talking to a supplier.
Why is my real packaging cost higher than the supplier’s unit price?
Usually one of four things: setup and tooling that the supplier bills once and you have not amortized, freight and duties that were quoted separately or not quoted at all, waste running above the assumed yield, and dividing the run by the units ordered rather than the units actually produced after setup waste. All four are fixed by asking the right questions before you compare.
How much should packaging cost as a percentage of retail price?
The published ranges are unreliable because most of them lack a stated year, a stated methodology, or a stated denominator. Derive your own instead: work back from your retail price and target margin to the packaging budget per order, then divide by your unit count to get the per-unit target you can actually manage.
How do I work out the break-even order quantity for custom packaging?
Subtract the custom unit price from the stock unit price, then divide the total one-time cost of custom tooling and setup by that difference. When the custom unit price moves, recalculate — a rise in material prices moves the break-even higher, because the saving per unit shrinks.
What is a typical packaging waste rate, and where do I find mine?
There is no rate that transfers directly from another operation. Record the material you lose over a defined period, divide its cost by the orders shipped in the same period, and use that. Until then, use a temporary allowance, label it as an estimate, and replace it as soon as the first period of data lands.
References
- U.S. Bureau of Labor Statistics, Producer Price Index by Industry: Corrugated and Solid Fiber Box Manufacturing(series PCU322211322211),https://data.bls.gov/timeseries/PCU322211322211— retrieved November 5, 2026.
- U.S. Bureau of Labor Statistics, Producer Price Index by Industry: Paperboard Mills(series PCU322130322130),https://data.bls.gov/timeseries/PCU322130322130— retrieved November 5, 2026.
- U.S. Bureau of Labor Statistics, Producer Price Index by Industry: Plastics Material and Resin Manufacturing(series PCU325211325211),https://data.bls.gov/timeseries/PCU325211325211— retrieved November 5, 2026.
- United States Postal Service, Mail & Shipping Services(dimensional weight calculation and nonstandard package surcharges),https://www.usps.com/ship/mail-shipping-services.htm— retrieved November 5, 2026.
- International Trade Commission, Harmonized Tariff Schedule of the United States, 2026 HTS Revision 21,https://hts.usitc.gov/— retrieved November 5, 2026.
- Office of the United States Trade Representative, China Section 301-Tariff Actions and Exclusion Process,https://ustr.gov/issue-areas/enforcement/section-301-investigations/tariff-actions— retrieved November 5, 2026.
- International Safe Transit Association, Test Procedures,https://ista.org/test_procedures.php— retrieved November 5, 2026.
- U.S. Small Business Administration, Break-even point,https://legacy.sba.gov/business-guide/plan-your-business/calculate-your-startup-costs/break-even-point— retrieved November 5, 2026.

ManLuen Plastic Packaging Company, which is specialized in the production of Plastic Food Packaging for more than 20 years. Our products are made from 100% virgin and BPA-Free PP, PS, and OPS comply with FDA and European Standards.
 EN
 ZH
 FR
 PT
 ES
 KO
 JA